
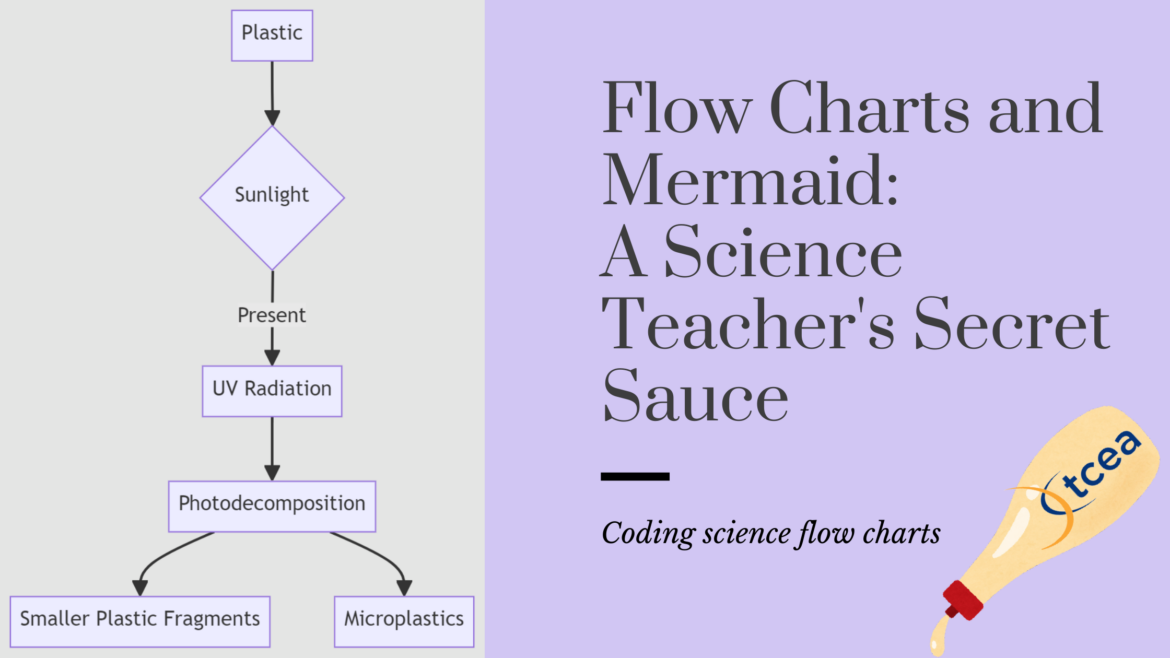
Getting students buzzing about the steps of a scientific process isn’t easy; helping them think through concepts and process, even harder. Imagine if you could engage them with flowcharts and learn the same critical content. One way to get it done is to combine flowcharts and coding.
Use flowcharts as visual tools that make student cognition visible to you and to peer learners. This can aide students in understanding and applying scientific concepts. What’s more, it can help with the new science Texas Essential Knowledge and Skills (TEKS).
A Quick Note: This blog entry shows examples of science-related flowcharts. I created each using Mermaid code, which I will explain later in the blog entry. You can see the code and the corresponding diagram online. A free mini-course for sixth grade students is also included and it’s great for grown-ups, too.
Visualize It
Flowcharts help students visualize the non-linear, iterative nature of scientific inquiry. It helps them see that science is more than a collection of cold facts. Instead, students practice decomposition and systematic disconfirmation.

Let’s explore these two terms in the context of flowcharts.
Decomposition
Decomposition involves breaking complex problems or systems into smaller, more manageable parts. When this is done, it makes tough concepts more accessible. You can represent it in this way:
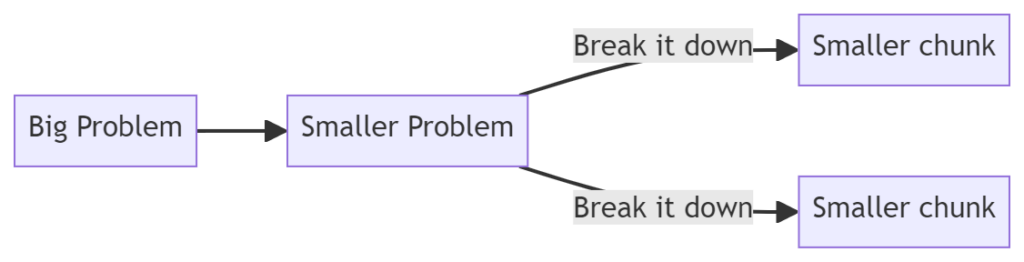
Then, you can solve the smaller problems on your way to take care of the big one.
Flowchart Examples
Consider these examples, only two of the several made and available to you online (get a copy of the Google Doc). All the flowcharts below were made by the author.
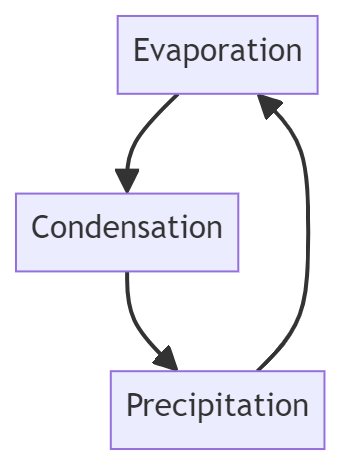
The Water Cycle
Use a flowchart to illustrate the stages of evaporation, condensation, and precipitation.
Decomposition of Food Waste in a Compost Bin
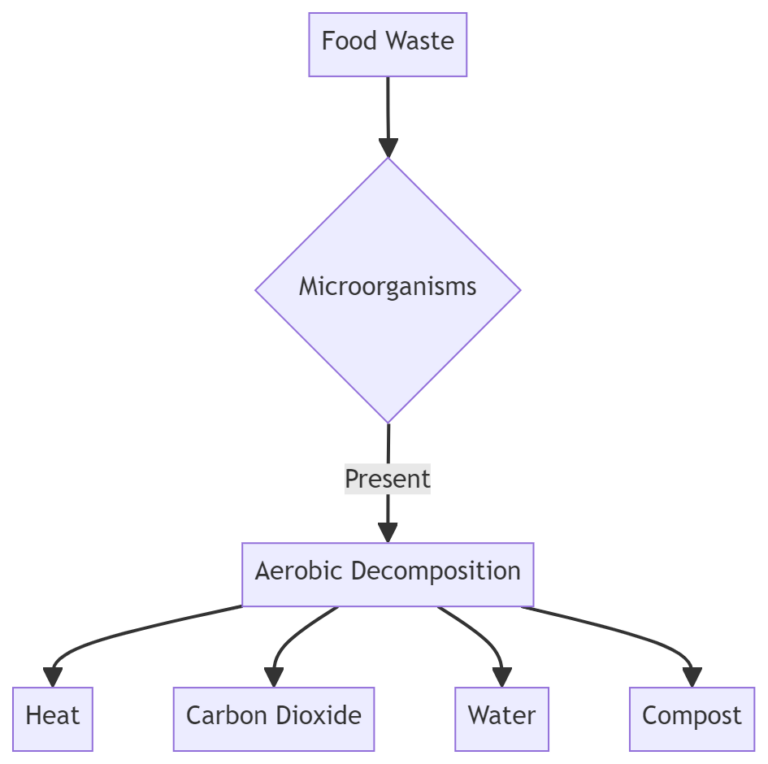
Those are simple examples. But flowcharts aren’t only about processes that occur in the world around us. They can also be about claims that are made.
Systematic Disconfirmation
Scientists have the opportunity to develop testable hypotheses, then spend time trying to show how wrong they might be. This process is known as systematic disconfirmation. It’s the “identification of evidence that contradicts or challenges an initial belief or theory” (source). Here’s are two ways to break it down.
Five-Step Process
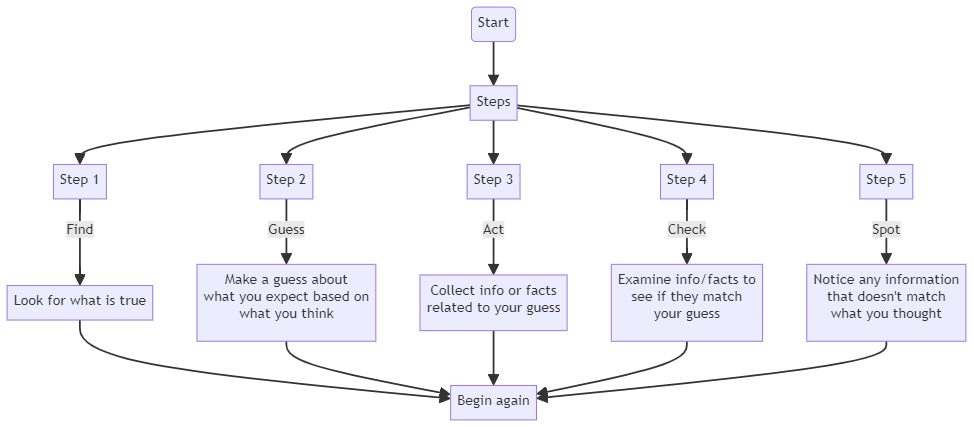
You can also follow a three-step process to disconfirmation, such as:
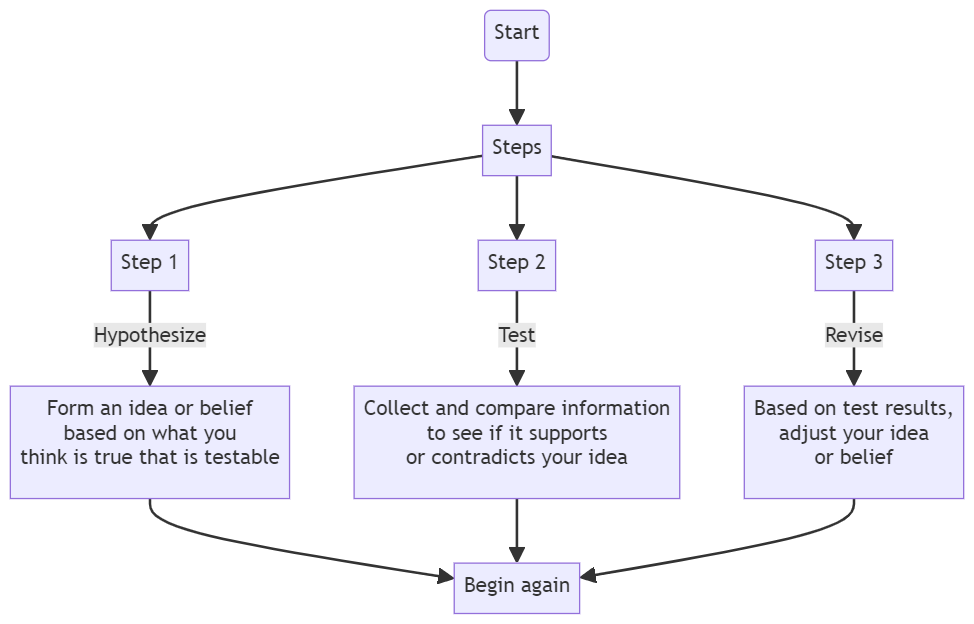
As you can see, these processes have the potential to promote critical thinking and engineering practices.
Promoting Critical Thinking and Engineering Practices
Flowcharts do not only make concepts simpler to understand, they also promote critical thinking. Imagine presenting students with a scientific mystery to solve by breaking the problem down in manageable pieces. Then they apply a systematic disconfirmation process to it.
When students create their own flowcharts, they’re not just passively absorbing information but are also engaged in the idea construction process. They do this because they have to map out their processes and identify any missed steps. This fosters a sense of ownership over the learning process.
One way to introduce students to flowchart creation and thinking problems through is to have them use Mermaid code.
The Benefits of Coding
There is a lot of research on the value of teaching students to code. Below are just a few.
| Benefit | Description | Source |
|---|---|---|
| Improved Problem-Solving Skills | Coding helps students develop better problem-solving abilities by engaging them in logical and structured thinking processes. | Brannon and Novak, 2019 |
| Enhanced Cognitive Skills | Learning to code can improve cognitive skills such as planning, response inhibition, and mathematical problem-solving. | Scherer et al., 2021 |
| Increased Engagement and Motivation | Programming courses effectively motivate and engage students, making learning more interactive and enjoyable. | Aljameel, 2022 |
| Development of Computational Thinking | Coding fosters computational thinking, which includes skills like algorithmic thinking, pattern recognition, and abstraction. | Popat and Starkey, 2019 |
| Boosted Executive Functions | Coding activities have been shown to improve executive functions such as planning and task management in young students. | Coding in Primary Grades, 2019 |
| Higher-Order Thinking Skills | Coding enhances higher-order thinking skills, including critical thinking and creativity. | Brannon and Novak, 2019 |
| Transfer of Learning | Skills learned through coding can transfer to other academic domains, enhancing overall academic performance. | Scherer et al., 2021 |
Perplexity Pro AI-generated table, all sources verified by author
Now that you’ve had the opportunity to see peer-reviewed research on the benefits of coding in K-12 classrooms, let’s take a look at a simple way to introduce it.
Introducing Mermaid Code
Coding has always been difficult for me, but I took to Mermaid code quickly. In the classroom, I want quick results that lead to success. That’s why I like Mermaid code as a way to introduce coding without scaring people off.
Explaining Mermaid Code
Here’s an AI-generated definition of Mermaid coding:
Mermaid coding is a special way of making simple drawings using words and symbols on a computer. It’s like giving the computer instructions to create pictures for you, such as boxes, circles, and arrows that connect them.
For example, you can tell the computer to draw a box and write “Start” inside it. Then, you can tell it to draw an arrow from the “Start” box to another box with the word “End” inside.
Mermaid coding helps you create diagrams, charts, and other visual things quickly without having to draw them by hand. It’s a fun and easy way to show ideas and how things work using a computer. In simple terms, Mermaid coding is like using a secret language to tell the computer what to draw for you.
This is a fun way to introduce rapid prototyping (a key component of the Engineering Design Process) at little to no cost. Students are able to adjust diagrams on the fly by editing the code. Let’s take a look at an example.
A Modified Water Cycle Example
To generate the code for the water cycle flow chart earlier in this blog entry, I used the code below:
mermaid graph TD;
A[Evaporation] -->|B[Condensation];
B --> C[Precipitation];
C --> A;
mermaid graph TD;
A[Evaporation] -->|B[Condensation];
B --> C[Precipitation];
C --> A;
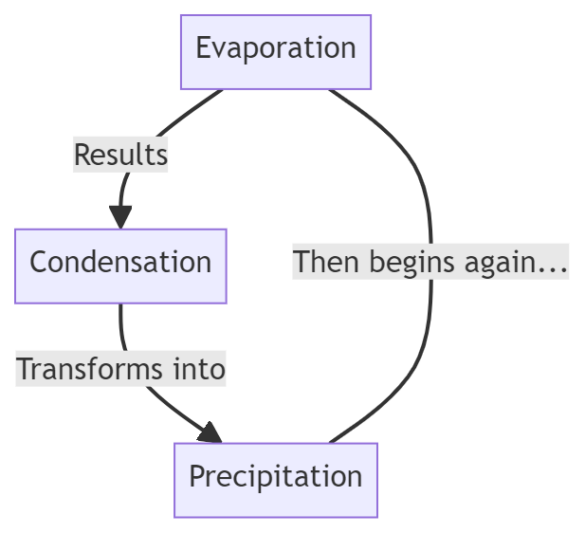
With this example, one can easily begin to see how Mermaid code works. I can make modifications to that code to get different results:
graph TD;
    A[Evaporation] -->|Results| B[Condensation];
    B -->|Transforms into| C[Precipitation];
    C ---|Then begins again...| A;
graph TD;
A[Evaporation] -->|Results| B[Condensation];
B -->|Transforms into| C[Precipitation];
C ---|Then begins again...| A;As you can see, in this version of the flowchart, I’ve added labels for the connectors. This yields a different result than the one introduced earlier in this blog entry:
Simple and Adaptable
The secret to Mermaid is its linear nature. One thing leads to another. As a result of its predictability, Mermaid code integrates well with web technologies, such as:
- HTML
- Cascading Style Sheets (CSS)
- JavaScript
- Markdown editors
- Project management software
- Documentation generators
This is important because it means you can embed Mermaid diagrams into web pages. Introducing students to it is an on-ramp to learning coding.
Students then can begin to use Mermaid code in designing flowcharts about scientific processes. In time, they can use it for online tutorials, educational content, or interactive visualizations.
Here’s a short video tutorial that was helpful for me. This quick reference guide may also be helpful. A few more videos and resources appear at the end of this blog entry.
AI-Powered Mermaid Code Assistance
AI chatbots can generate Mermaid code for flowcharts based on simple text descriptions. For example, a student could describe a scientific process in plain language, and an AI tool could generate the corresponding Mermaid code:
Prompt Input: The water cycle involves evaporation, condensation, and precipitation. Evaporation leads to condensation, which leads to precipitation, and the cycle repeats.
Output:
graph TD;
    A[Evaporation] --> B[Condensation];
    B --> C[Precipitation];
    C --> A;
graph TD;
A[Evaporation] --> B[Condensation];
B --> C[Precipitation];
C --> A;This AI-assisted approach can make the creation of flowcharts even more accessible and efficient for students. Try asking one of the following AI chatbots to develop code for a flowchart:
Then try that code in a markdown editor or free web-based tool. All of the solutions below support Mermaid code and are free:
| Product Name | Editor Type | Account Required | Device |
|---|---|---|---|
| Stackedit | Markdown editor with Mermaid code support | Yes (Google-friendly, web-based, free) | Desktop |
| Joplin | Markdown editor with Mermaid code support | No (free, downloadable) | Desktop or smartphone |
| Mermaid Live Editor | Mermaid code editor | No (web-based, free) | Desktop |
| Mermaid Live | Mermaid code editor | No (web-based, free but an account can be created) | Desktop |
Compiled by author
Mermaid Code Resources
Below you will find details on a five-module mini-course with 15 lessons in it that’s designed for sixth grade students as an introduction to Mermaid. Each module ends with a PBL scenario.
| Module | Title | Lessons | PBL Scenario |
|---|---|---|---|
| 1 | Dive into Mermaid Basics | 1. What Is Mermaid? 2. Drawing Your First Flowchart 3. Adding Styles to Your Flowchart |
My Morning Routine |
| 2 | Charting New Waters | 1. Understanding Graph Types 2. Creating Sequence Diagrams 3. Styling Sequence Diagrams |
A Day in the Life |
| 3 | Navigating Complex Diagrams | 1. Introduction to Gantt Charts 2. Creating Gantt Charts 3. Styling Gantt Charts |
Planning a School Event |
| 4 | Mastering Mermaid | 1. Advanced Flowcharts 2. Advanced Sequence Diagrams 3. Advanced Gantt Charts |
Organizing a Science Fair |
| 5 | Mermaid Masterpieces | 1. Combining Diagrams 2. Interactive Diagrams 3. Presenting Your Diagrams |
Showcase Your Skills |
codingflowchartMermaidscienceSTEM