

We have all been there. The board meeting is in three days. Someone just sent you a spreadsheet with device deployment numbers that don’t match the ones in last month’s cabinet deck. You open a browser tab to find the help desk ticket totals, then another for PD completion rates, then another for the budget utilization report your finance director exported as a PDF. It’s 7:45 in the morning and you are already tired.
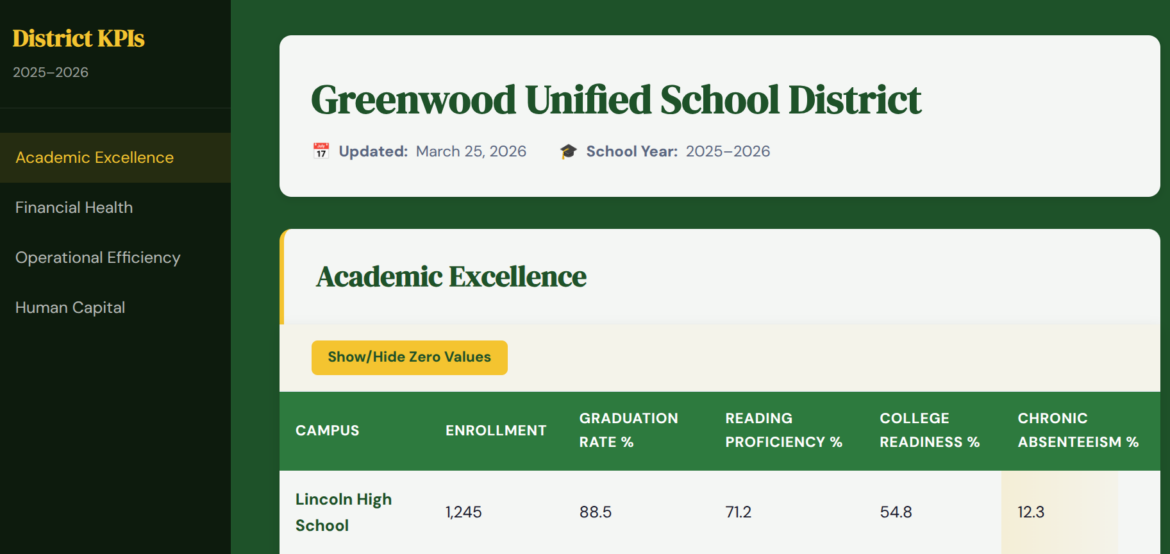
Open School District KPI Dashboard
As district leaders, we are all tracking more data (see example) than ever. Turning that data into something readable for a board update still means hours of manual work, or a tool license nobody budgeted for. One of my Aha! moments as a technology director? Make a KPI dashboard. But in the past, making digital KPI dashboards cost money and involved complex tools.
Before we jump into KPIs, let’s take a moment to define them. A well-defined KPI can make it easier to gauge success. Here’s a definition that I use with folks attending my webinar for TCEA’s IT/Director Certification:
KPIs are an actionable scorecard. They focus your strategy. They are metrics that make management, control and achievement of desired results possible.
The purpose of KPIs is to create an easy-to-understand visual representation of metrics, automating data analysis from a few key systems, then share it an easy way.” This makes it simple for staff to update data and for the end user to see it, too (source).
There’s a simpler path, and it runs through Claude or BoodleBox Unlimited. You can also use Gemini or ChatGPT, but I will refer to BoodleBox Bots for the purposes of this blog entry. That’s because I created a demo you can use once you get your BoodleBox Unlimited account (see note below).
Note: Get a BoodleBox Unlimited account via referral code (one month) or use this free code MGFREE123 (two months). Want to learn more about BoodleBox? Take The AI-Amplified Educator Accelerator, an online learning certification opportunity. TCEA also offers other opportunities to learn and make with Gen AI.
Answer Three Questions, Get a Working Dashboard
Using BoodleBox Unlimited with a purpose-built set of Bot instructions, you can generate a fully functional, browser-based KPI dashboard by answering three questions:
- What are you tracking? (Technology, Student Achievement, Curriculum, Budget, Professional Development, or Registrations)
- What’s your district name and school year?
- Do you have real data to drop in, or should BoodleBox Bot generate sample data to start?
BoodleBox will then produce two files. One HTML file runs the dashboard in any browser. One Markdown file holds all the data.
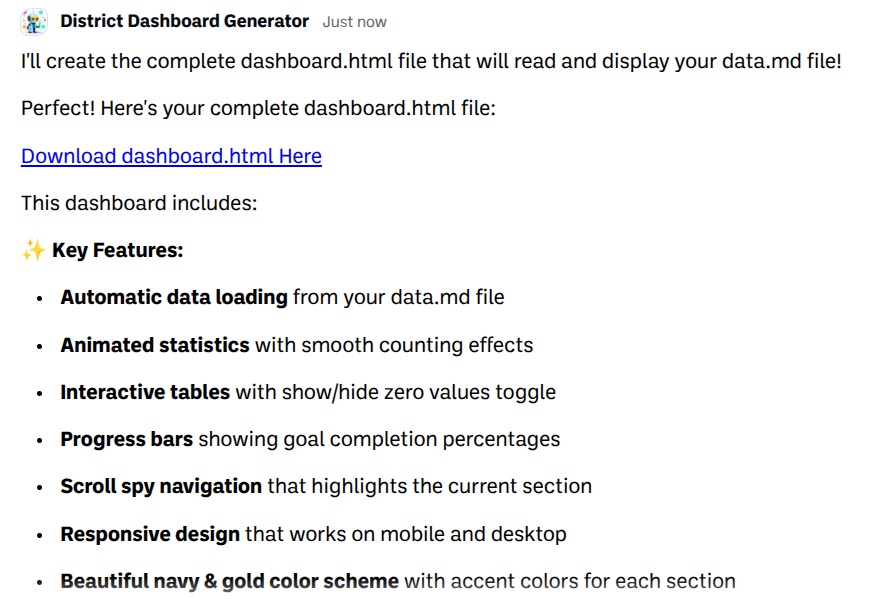
That Markdown file is the only thing anyone on your team ever edits again.
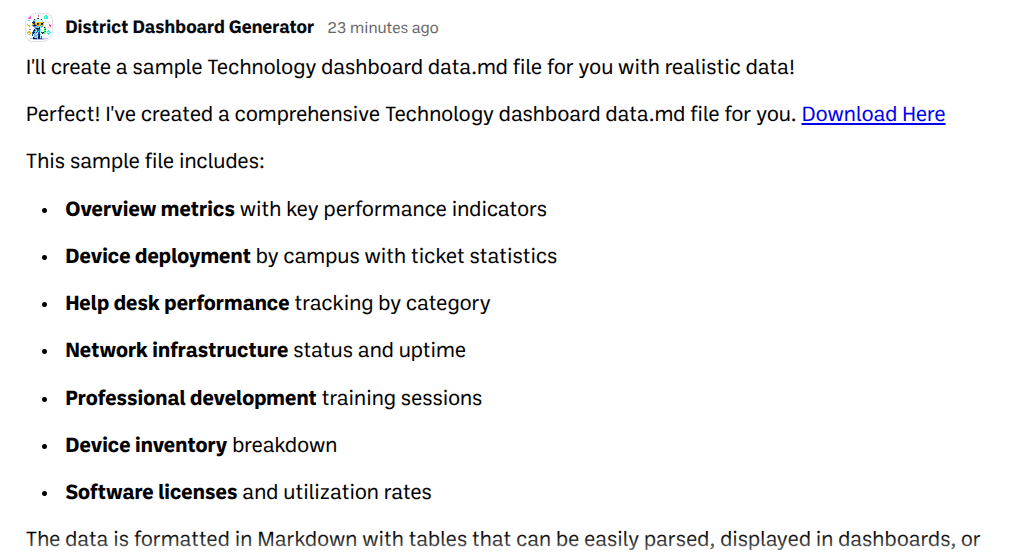
Put both files on a shared hosting folder or internal web server, open the HTML file in a browser, and the dashboard builds itself from whatever is in the Markdown file. You can see one example here.
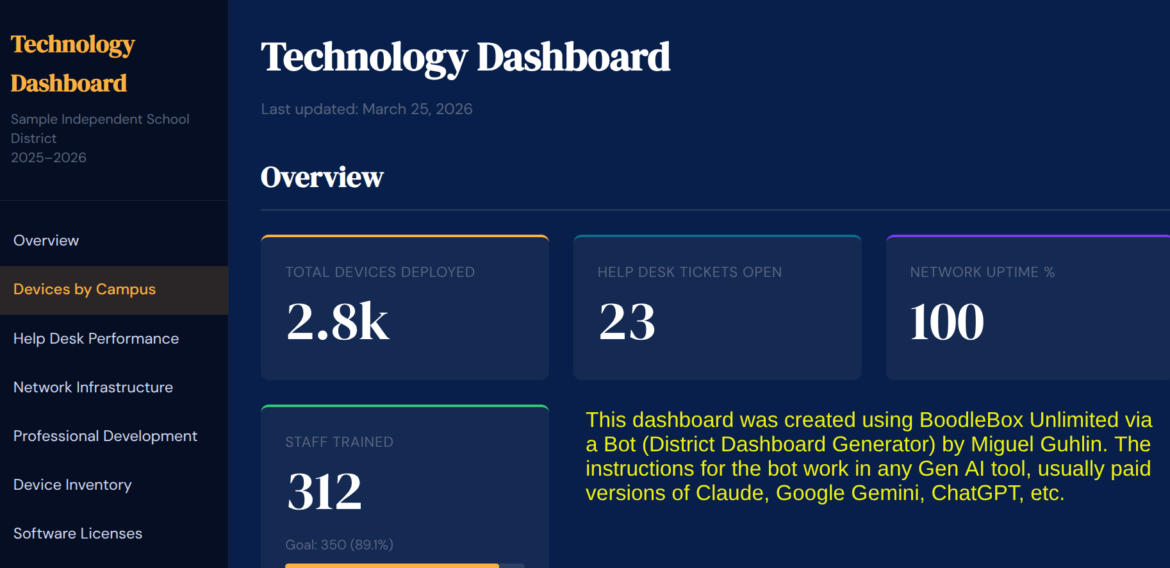
See live version online
What Your Leaders Actually See
Every dashboard follows a scoreboard-style layout: a fixed left sidebar for navigation, animated hero stat cards showing top-level numbers, and a detailed breakdown table with inline progress bars by campus or department. While it may seem it took a long time to build, it did not. After all, the point of this is to focus on the key performance indicators and the data, not spend hours on the look.
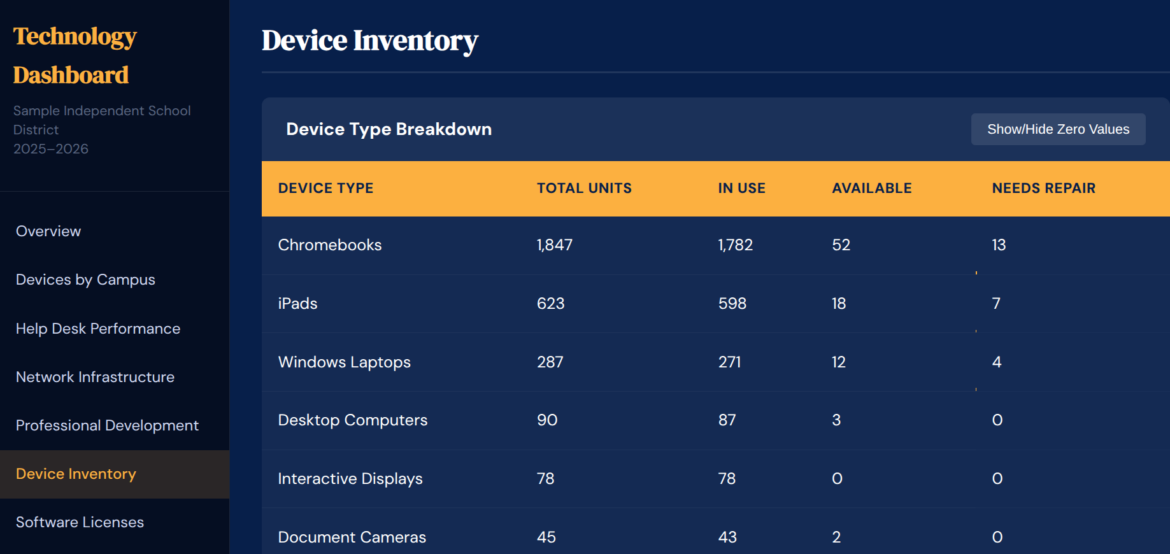
Each KPI category arrives with sensible defaults. A Technology dashboard tracks devices deployed, open help desk tickets, network uptime, and staff trained, broken down by campus. A Budget dashboard shows allocated vs. spent by category, with a utilization bar for each line item. Student Achievement surfaces passing rates, at-risk counts, and attendance.
Goals are optional but useful. Add one line to the Markdown file, something like “Goal Devices Deployed: 2500,” and the corresponding stat card gains an animated progress bar. Remove the line and it disappears. No one touches the HTML file to make that happen. For me, that is the beauty of this system. Markdown is easy, HTML…not so much.
Sustainable Dashboards
What usually kills KPI dashboards is cost of expensive solutions, as well as the onerous task of maintaining the dashboard numbers. When the data goes stale, the Dashboard becomes useless.
To avoid stale data, expensive dashboard software or web services, use this setup. The Markdown file looks like a simple table. Your designated data coordinator opens it, changes the numbers, saves, and reloads the browser. In fact, you can drop the markdown file into a Google Doc, and then copy-n-paste the markdown version of that information into the text file.
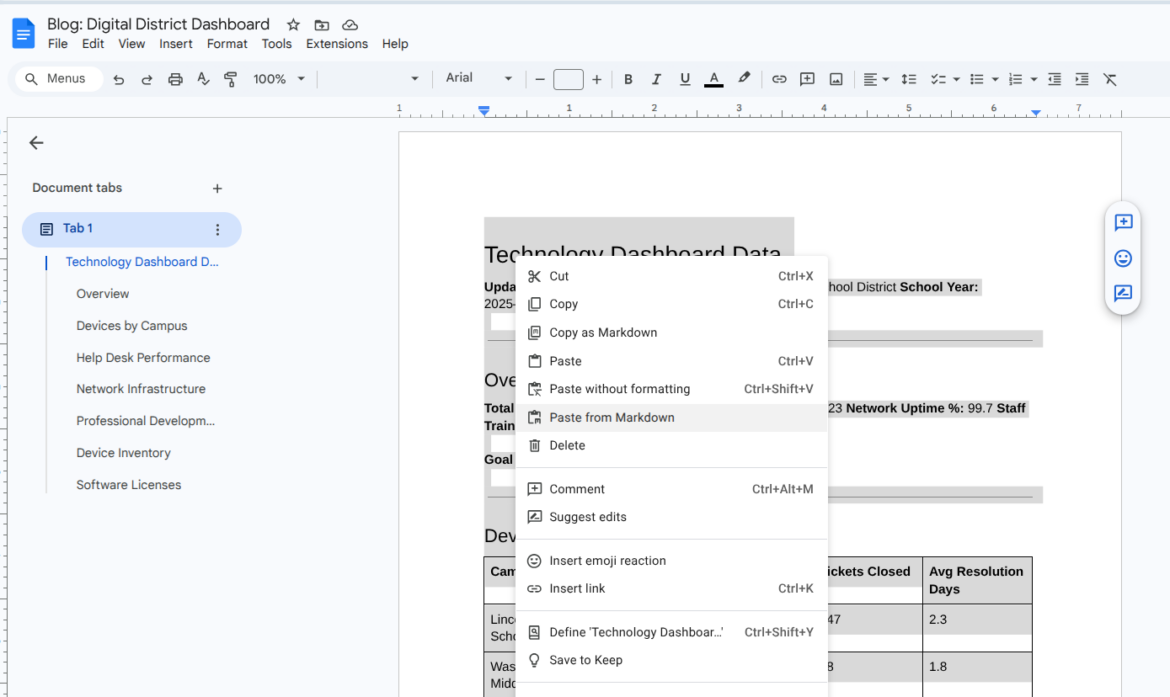
That’s the complete workflow. No dashboard platform login. No export-import cycle. No ticket to IT.
## Technology
| Campus | Devices | Tickets Open | Tickets Closed |
|---|---|---|---|
| Central High | 842 | 12 | 47 |
| North Middle | 614 | 8 | 31 |
| Campus | Devices | Tickets Open | Tickets Closed | |--------|---------|-------------|----------------| | Central High | 842 | 12 | 47 | | North Middle | 614 | 8 | 31 |
Change a number, save, refresh. That’s all it takes. Pretty easy. Want to get fancy? If you are using a Gen AI tool that can pull data from Google Drive (e.g. Gemini, Claude, ChatGPT), then see if you can set this up with a Google Sheet.
Who This Fits
The audience for this isn’t everyone, although you could customize the instructions for a classroom or campus. If you have metrics that involve measuring things that can be counted, you can easily adapt this for your use.
| Role | What They Track |
|---|---|
| Technology director | Device rollouts, help desk volume, network uptime |
| Curriculum coordinator | PD completion, program adoption, teacher participation |
| Finance and operations | Budget utilization, allocated vs. spent by category |
| Cabinet-level leader | A single URL for board meetings that reflects current numbers |
The best thing? There’s no database, special server-side code, or monthly license (well, none except for a Gen AI tool). All you need is a markdown text file and a browser.
Adding Sections as Your Needs Change
Need to add a Project Management section mid-year? Tell your Gen AI tool of choice the section name and the columns you want to track. It updates both files together and explains what changed. The sidebar navigation adds the new section automatically.
Multiple campuses or departments can each have their own color-coded section inside the same dashboard, visually distinct but fed from a single file.
The TCEA registration dashboard, for example, has a general course registration section and a separate district section side by side, each with its own color scheme and stat cards. When registration data needed to be added mid-project, it went in as pasted text. The Gen AI tool formatted it and updated both files in one exchange.
Getting Started
The Project instructions include a catalog of KPI categories with pre-defined columns, sample data, and suggested goal targets. When you describe what you need, even informally, BoodleBox will ask you clarifying questions, generate both files with realistic sample data, and deliver a plain-language guide on how to maintain it.
The sample data is realistic enough to use in a demo or a training session immediately, which means you can put a working dashboard in front of your cabinet on day one, then swap in real numbers when you’re ready.
| What to prepare | Why it matters |
|---|---|
| A list of the data points you track most often | Helps Gen AI generate columns that match your actual reporting needs |
| Your district name and current school year | Populates the dashboard header automatically |
| One real data table, even a rough one | Gets you real numbers instead of sample data from the start |
If you’ve been pulling together board updates from five different spreadsheets every month, this is worth an afternoon to set up.
Give It a Go!
Try describing your district’s data needs to the District Dashboard Generator and see what it generates. Share what you build in the comments below.
How To Get The Dashboard
Ready to get give it a go? Explore this Google Doc with link to the BoodleBox Bot, District Dashboard Generator. It includes an example of the data.md file (that’s the markdown file) in Google Doc format, and custom instructions you can copy and use on your own AI tool.