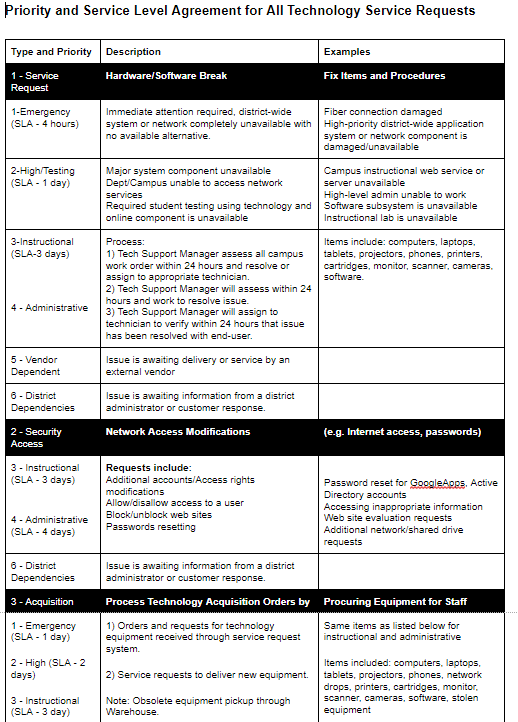
“I want you to come up with metrics,” said my assistant superintendent. He wasn’t speaking only to me. His gaze went around the room touching on each of the directors seated in front of him. “They should be short, to the point, and tell me in one page how you are getting things done.” This was my first introduction to the concept of key performance indicators (KPIs). In this blog entry, we’ll explore some ways you can use KPIs to gauge effectiveness.
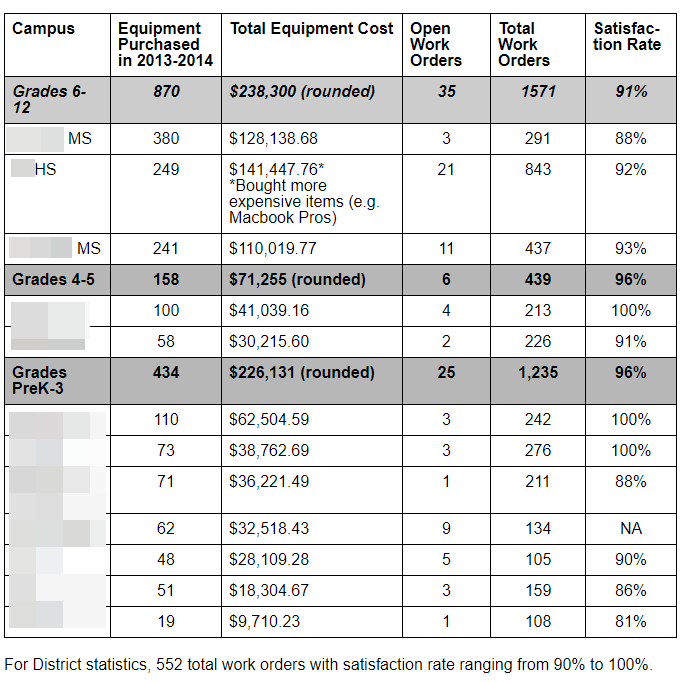
Defining KPIs
Before we jump into KPIs, let's take a moment to define them. A well-defined KPI can make it easier to gauge success. Here's a definition that I use with folks attending my webinar for TCEA's IT/Director Certification:KPIs are an actionable scorecard. They focus your strategy. They are metrics that make management, control and achievement of desired results possible.There is a purpose to setting up KPIs, says Steve Young (former CTO for Judson ISD, San Antonio, TX, now CTO for VIA Transit). He says, "It is to create an easy-to-understand visual representation of metrics. The goal is to integrate and automate data analysis from a few key systems and share this data in a public way." This makes it simple for staff to update data and for the end user to see it, too.
Spotlight District: Crowley ISD Features a Digital Dashboard
Jerry Allen, CTO, uses several tools to power the District's digital dashboard. He combines Google Sites, Sheets, Domo, and Pingdom. The first three yield a wide variety of viewable data. The last, Pingdom, provides insight into the status (e.g. offline or up/down) of web-based services.
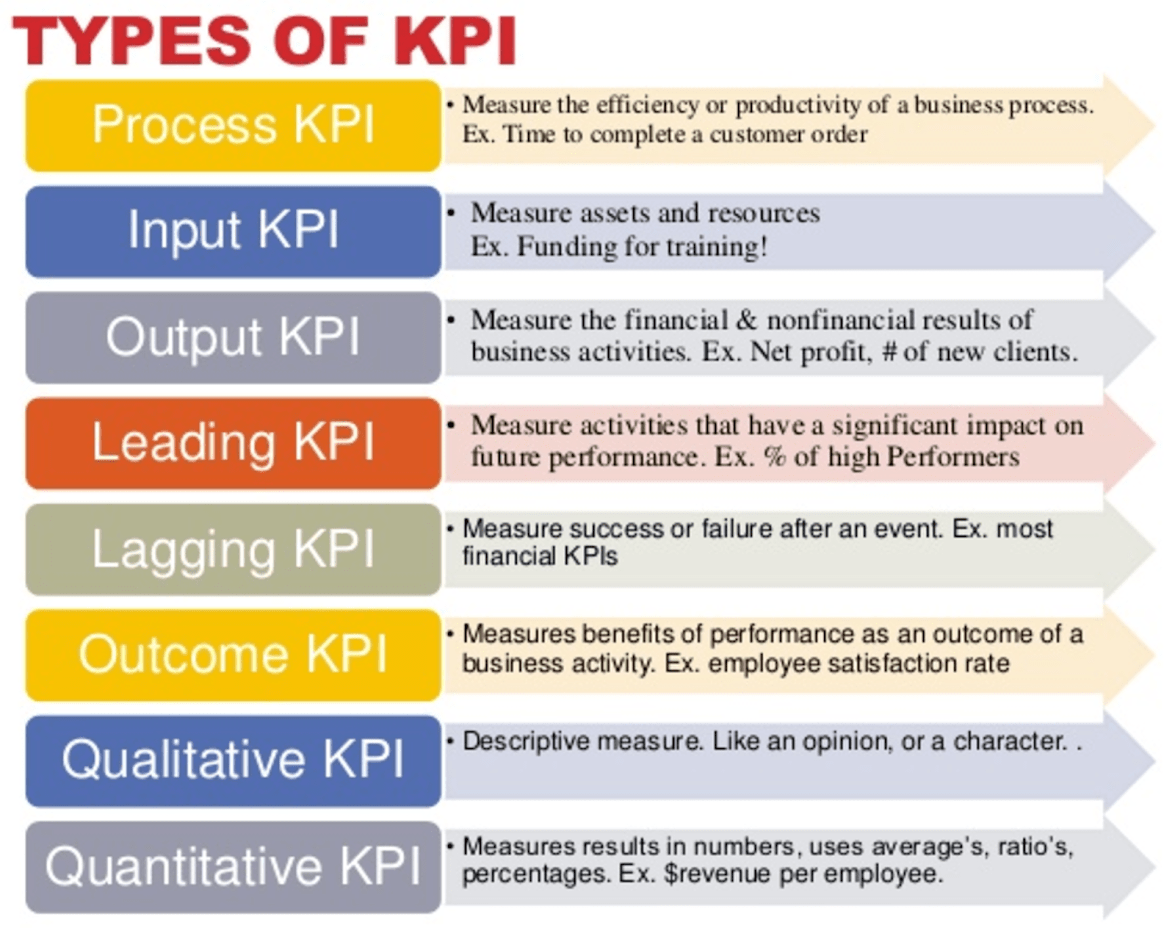
Types of KPIs
There are many types of key performance indicators. While you can find a complete list online, here are a two examples:Input KPIs measure assets and resources invested in or used to generated results. For example, they could help you gauge the answers to these questions:
- How much has staff spent to enhance employee knowledge and capacity? Think of this as useful for online or face-to-face certification programs.
- How much time has your staff spent planning a future initiative or project?
- How many people did the HelpDesk or onsite support serve in a given time?
- How many staff members received professional learning on blending technology into the curriculum?
Case Study: Crowley ISD
Since I first saw web-based data dashboards highlighting KPIs in my work in San Antonio ISD a scant ten years ago, the technology has gotten easier. In East Central ISD, I made KPIs with Google Sheets and Sites. Each Sheet had to be filled in with data collected one row at a time. Then the data was graphed. On a published update schedule, the graphs were updated. To be honest, my cobbled together data dashboard was light years ahead of anything any other director could put together at that time.Now you can create data dashboards with low-cost tools that update in real time. Crowley ISD’s Jerry Allen has done a phenomenal job of featuring usable data.
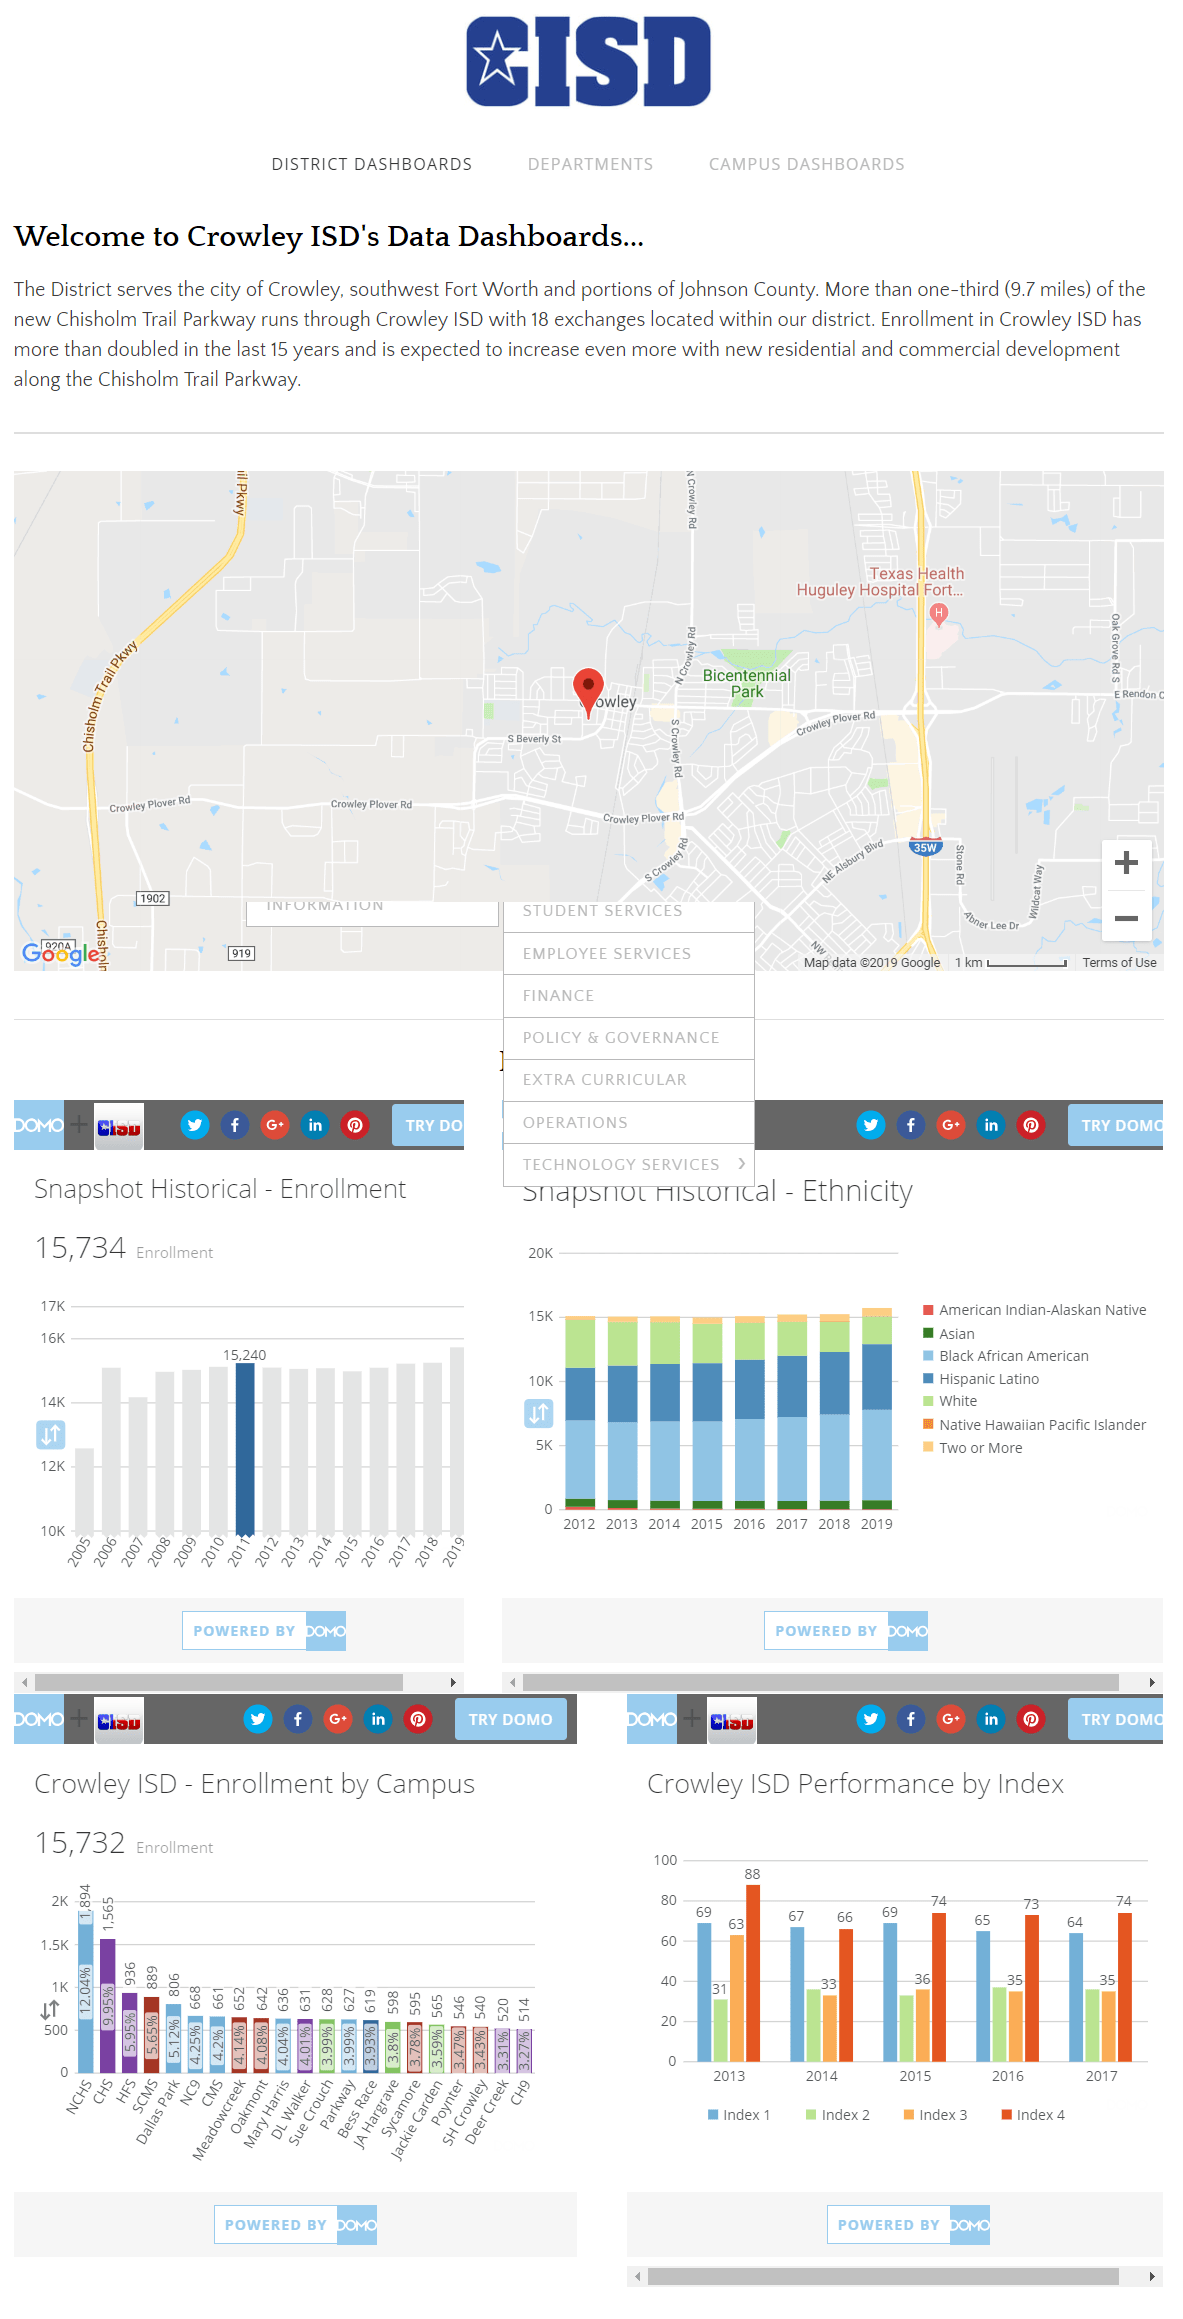
Take a quick visit to Crowley ISD’s Data Dashboard website (a Google Site). In no time, you’ll be drooling (like I was) over the data available. When I asked Jerry Allen how he started off, he said, “I started putting numbers in a Google Sheet. The Sheet connects to Domo, which gives me embed code for a live graph. I put that code on a Google Sites page.” Over time, the people who owned the data learned how to add to it themselves.
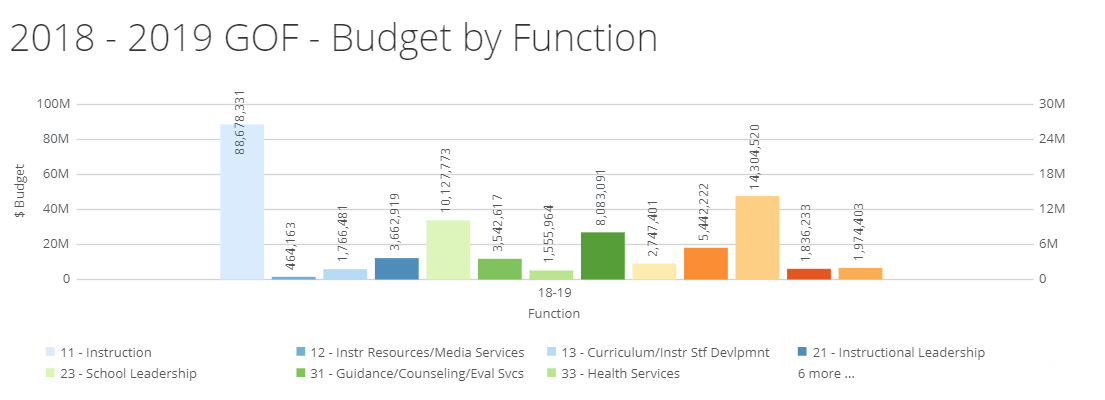
As you might imagine, putting data into Google Sheets and then reflecting that data as a graph via Domo is quite straightforward. What KPIs are you using (or could be using) to capture your department’s efforts in alignment to district strategic goals and objectives?
Sample KPIs
Looking for examples of KPIs specific (link goes to Google Doc you can get a copy of) to your area? Here is a quick round-up of a few popular ones you can find online.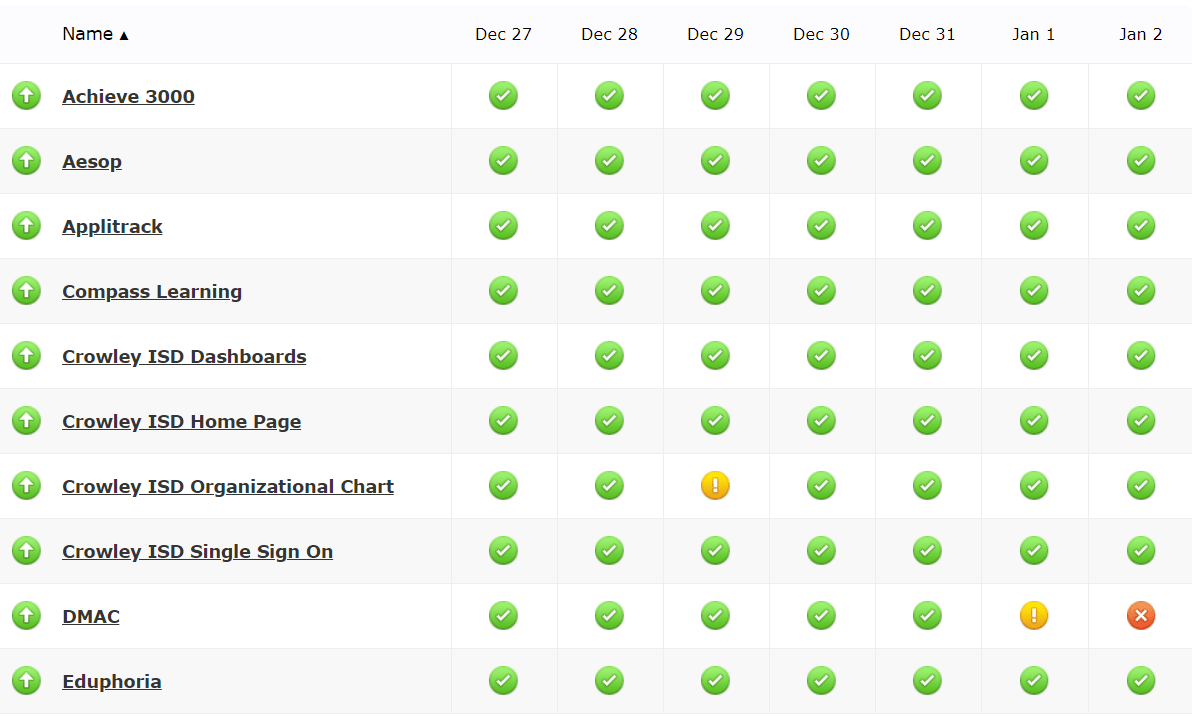
Instructional Technology
- Percentage of Classes Using Technology
- Percentage of Administrators Using Technology
- Social Media Engagement
- Level of Teaching Innovation (LOTI) or Brightbytes Clarity Survey Data
HelpDesk
- Calls to HelpDesk Per Month
- Average Handle Time for HelpDesk
- Average Response Time for Onsite Support
Technology Administration or Infrastructure
- Technology Budget as a Percentage of Total Expense
- Out-sourced versus In-sourced Services Cost Overview
- Cost and Quantity of Devices Deployed in Schools
- Inventory: How many items are part of an active inventory, have been removed from inventory, are "aged" and have become obsolete. This should be connected to the equipment replacement plan and costs planned in advance.