
I read an article about Claude’s ability to create interactive visuals. The examples in the article didn’t excite me so I thought I would ask Claude for some prompts. These prompts would result in interactive visuals. I decided to do this on my phone, not bothering to start up a laptop or desktop. So everything below was done via my phone. 🤯
Prompt Example
To start, I went with this one first from several generated:
Create an interactive visual showing how photosynthesis works with sliders for sunlight intensity and water amount, displaying glucose/oxygen output and plant color changes.
Easy, right? I ran it by Gemini 3 Pro just to see what it would do:
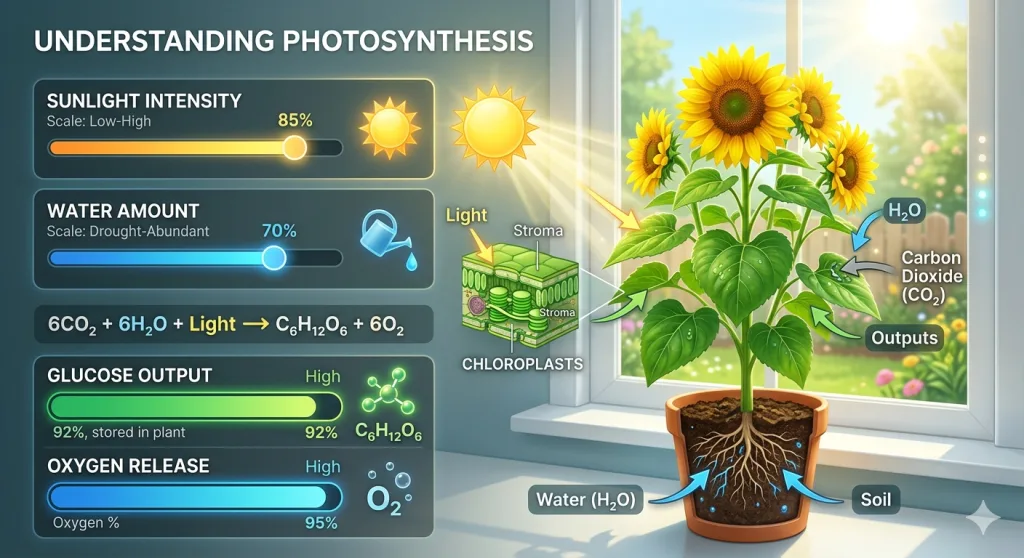
Gemini’s note: “While I can’t generate a truly interactive experience, here is a detailed visual representation that models how an interactive tool for photosynthesis might function, capturing a specific moment in time.”
As beautiful as that image is, I gave the same prompt to Claude Haiku 4.5 w Extended Thinking enabled.
Claude’s Interactive Visual
This was quite easy and amazing given I was only using Haiku 4.5, not Sonnet 4.6 or Opus.
Here’s the link to the web page with the photosynthesis simulator. And, a screenshot:
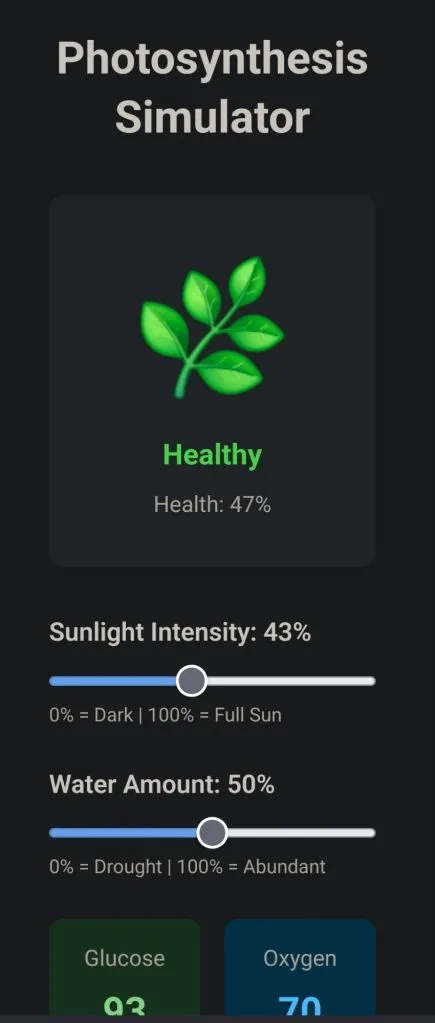
https://mguhlin.github.io/dev/phos.html
Cool, huh? I have a few more prompts to try out but this is going to come in handy. What will you do with this?